
One of the Sitecore Symposium sessions I attended was led by Sitecore’s Megan Engard, who provided a live demo with Tijana Delov of the Australia government’s Department of Industry, Science, Energy, and Resources (DISER). The session, titled “User Journeys and Path Analyzer: Optimizing a Government Site with Sitecore’s ‘Black Box,’” led off with a quick introduction to the purpose of the DISER site (business.gov.au), which is to assist Australians with decision-making related to starting a new business, growing an existing one, or closing one.
Because they’re a government site, they operate differently from an e-commerce site – for instance, most of their traffic is unpaid – but with more than 1200 pages of information, they have a clear need (and goals) to help people find information they need, as well as information they didn’t know they needed.
These were the four pieces of data about the site Engard used to formulate her analysis and plan:
- High rates of earned traffic
- Vast amount of content
- High percent of returning visitors
- Limited transactional goals (mostly on 3rd party sites)
With this in mind, and using Path Analyzer, Engard showed where and how DISER could most effectively use personalization on their site. The following recap of the session focuses on two key concepts: First, how to read Path Analyzer’s journey maps and, second, the three types of journey maps used for the analysis. I’ve grabbed screens from the Sitecore documentation for clarity, so the maps you see here don’t represent the DISER site.
DECODING MAPS IN SITECORE PATH ANALYZER
Path Analyzer visualizes not only visits (like more traditional analytics tools), but also journeys. Engard mentioned that they amount of data represented by the maps could be overwhelming, which is why many people avoid using the tool. But a quick look at how the data is organized provides some insight into how that data can be filtered and focused.
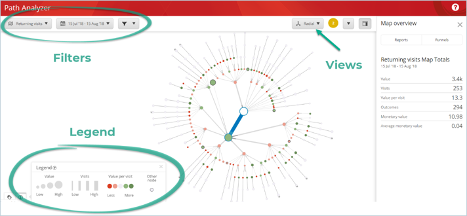
Path Analyzer’s map view screen, with legend. This is a radial view showing returning visits, while the demo used a vertical view showing all visits for the DISER site.
Circles represent pages, and the size of the circles indicate the value of the page, which is set by the user. In the example pictured above, the large green circles indicate high-value pages.
The lines connecting the circles indicate the number of visits; the thicker the lines, the more visits.
The colors of the circles indicate the value per visit for those pages, with the darker green being more valuable than the red circles.
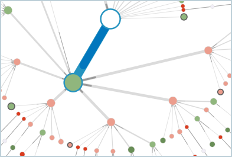
Detail view of Path Analyzer map. The large, green circles have the highest page value and the highest value per visit, while the small, red circles are lower value pages with lower value per visit.
One of the things to pay attention to is the patterns in the organization of the lines. Depending on your view, you’ll see them getting thinner from left to right or from top to bottom or in a clockwise direction. This helps you quickly pick out which high-value pages are getting the most visits and where you want to optimize.
Using the Ruleset Editor, you can use rules to help you drill down into specific patterns, visitor profiles, etc., to narrow your dataset to more manageable views – and more precise personalization.
PATH ANALYZER'S CUSTOM JOURNEY MAPS IN THE PATH ANALYSIS TOOL
Custom maps are based on default maps. For DISER, Engard selected the following three as being most useful to their specific business goals and the type of traffic they get:
Pattern Maps. Focuses on pages, filtering view by user-defined visitor patterns, and showing which pages they enter on and which ones they visit most.
Goal Maps. Maps created around one particular goal. Allows you to see the interactions leading to that particular goal and filters out the ones after the goal is reached. Reverse Goal Maps are especially useful because it puts the goal at the top of your node tree and allows you to work backward, noting which pages visitors went to before completing the goal.
Experience Maps. Include goals, entry and exit pages, and channels all in one map. Depending on how you configure them, you can see how different goals and pages relate to one another.
Custom journey maps can take as little as 3-6 hours to start providing usable data, but as many as 35-48 hours, depending on the amount of data you’re looking at and the complexity of the rules you implement.
Key Takeaways:
- Path Analyzer journey maps are highly customizable for your business goals, using standard pages as a template for organizing your data.
- Different maps offer different ways of filtering and analyzing your visitor journeys so you can optimize your pages and personalization efforts more precisely.
- Using Path Analyzer isn’t as difficult as you might think, especially if you filter them so they aren’t quite so overwhelming.
HOW ALPHA SOLUTIONS CAN HELP
At Alpha Solutions, we pride ourselves on staying current with the technology – so we have multiple Sitecore Specialists available for consultation projects – but we also hone the strategic skills needed to make the technology work for your business. Visit our Interactive Services page to learn more about how we can help you shape your vision into a plan.
For more on customer journey maps, read my article “What Is a Customer Journey Map (and Why Should You Create One for Your Marketing Strategy?”
You might also like multi-year Sitecore MVP Niket Ashesh’s article, 4 Powerful Advantages of Using Sitecore Analytics.
Did you miss Sitecore Symposium? Register now to view on-demand sessions!
If you registered for the Sitecore Symposium and missed this session, access the recorded demo here: https://sym.sitecore.com/sessions/19755542/subsession/25573764/LIVE-User-journeys-and-Path-Analyzer-Optimizing-a-government-site-with-Sitecores-black-box
If you haven’t yet registered, these recordings will be available until December 31, 2020, so there’s still plenty of time to register for on-demand recordings: siteco.re/SYMreg

ROLAND VILLEMOES
CTO