
An important note: In most of cases it’s already too late when we’re brought in. The application might be bad architected, having unnecessary logic and code – and sometimes shows a lack of Sitecore knowledge. But businesses need to get the site live – fast – “yesterday” would be the best.
With that offset we are looking for easy fixes and wins – not going in detail, refactor major parts etc. So what tools to use in this situation?
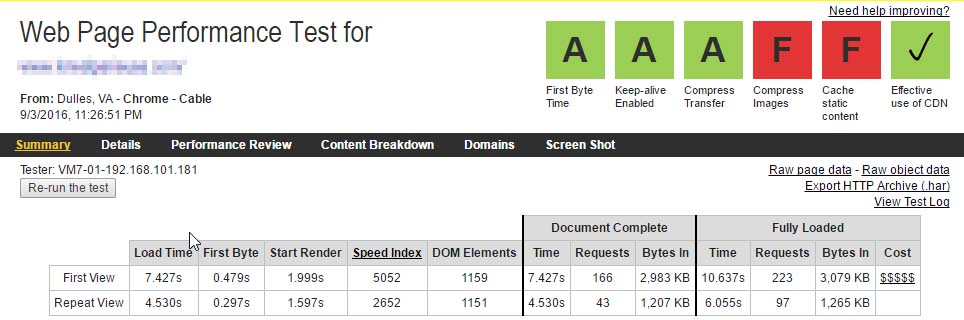
START BY USING THE OBVIOUS TOOLS: PAGESPEED AND WEBPAGETEST.ORG
Both PageSpeed and webpagetest are very easy to use and very helpful. They often identify a lot of easy ways to get better performance (and a lot of stuff that is hard to do something about fast).
But not knowing anything really about the application, these gives the obvious hints, and for most part some of the easy fixes.
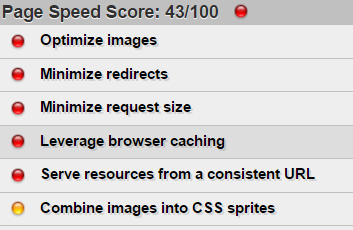
Things the we often find using these tools:
- Optimize image size & service scaled images
Mostly easy stuff to do. There’s a lot of good tools and libraries for that. Some situations demand from logic though; fx on responsive sites where the browser resizes, images must scale accordingly. Those situations are not that easy – but in general there’s a lot to gain from optimizing your images. This is also the situation where you would have Sitecore serving a scaled image that fits the original size for the requesting device, but if the user resizes you would most likely request the same size (original). Anything else would require some extra logic.
- Use gzip compression
This is an easy fix – and no code required. Almost any client nowadays supports gzip compression meaning that the content from the web server and to the client will be compressed. There’s a lot of posts explaining how to enable this.
- Minimize Redirects
Avoid all those redirects. Especially when sites tend to get longer chains of redirections – this is really hurting the experience for the user.
“SEO Experts” all have different views on the value of redirects. We have experienced clients where multiple redirects were a “good thing” due to the SEO expert’s advice on keeping the “SEO juice”. I understand it makes sense to handle redirects for request coming from other sites, but from within your own site, this is just stupid (sorry).
- Minification
Normally also an easy fix. As a hack you can simply use online tools to get js, css and maybe also html/cshtml file minified. Looking ahead, you should use tools for that (There’s a lot to choose from).
- Blocking javascript / defer parsing of javascript
If you can avoid it – get your javascript placed so that it will not be loaded during the first page load. Especially if it’s not needed on the first page load. Also avoid evaluating javascript until the full document is loaded.
- Lazy load of images
Normally this is not always an easy fix – but worth mentioning. Sometimes we see a lot of images being loaded before the full document is loaded. This is bad as the page will not start to render for the user. Best solution is to lazy-load all images – starting with images above the fold. Again – libraries, scripts and jQuery plugins exist for this.
CHECK THE SYSTEM "HEALTH CONDITION"
Before you start looking for the bottlenecks you should do the obvious – check the logs. That normally tells a lot about what’s working and what’s not.
- Check the Sitecore logs
- Check server’s system logs
- Check system performance counters
You can’t make Sitecore Rock’n’Roll if the foundation shakes the Blues – so to speak.
GET THE SITE UP RUNNING LOCALLY
Normally the next step we take is to get a copy of the site. That will not be a production setup at all, and that is not the purpose really. We want to identify application bottlenecks. For that, Sitecore has tools that’s very helpful.
Also – get a copy of the source code so you can look at the code, and identify exact fixes, and also try to make changes as you work through the optimization.
USE THE SITECORE DEBUGGER
Sitecore Debugger is great for identifying the components that performs. Don’t go into details about the exact numbers – that doesn’t matter. Focus on identifying the top 3-5 worst performing components.
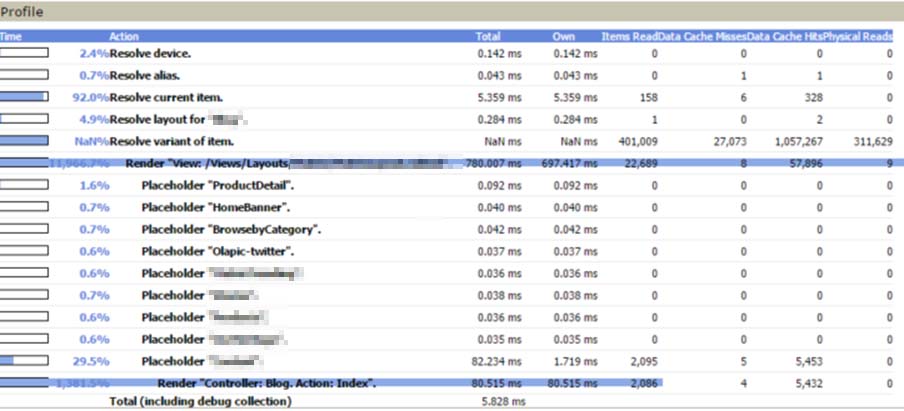
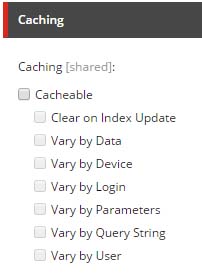
Use that information to take a look at the code behind those components. Also look at how caching is set up – often we experience that caching hasn’t been considered at all. And “yes” – I can be complex if a lot of personalization will be used on the website. But normally – that’s not the case.
CACHE.ASPX (/admin/cache.aspx)
The cache.aspx give you an overview on how the caches are set up, and how they change over time. Use to check for cache configuration – are the caches configured with the correct sizes etc.
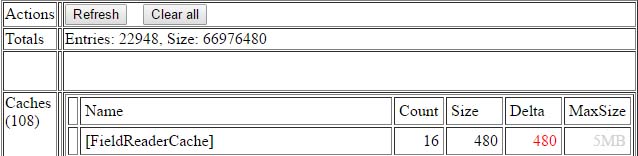
A Note on custom caches:
We often see that developers have used HttpContext for some custom caching – instead of using Sitecore caches. Both things will work, but using Sitecore cache will make these custom caches appear on the cache.aspx – which is pretty useful.
If you create custom caches, you have to remember to identify when and if these caches must be cleared on publishing. We often see that missing actually. So remember to create a processer that can be triggered on publish:end (and publish:remote:end) that handle the needed clearing of your custom cache:
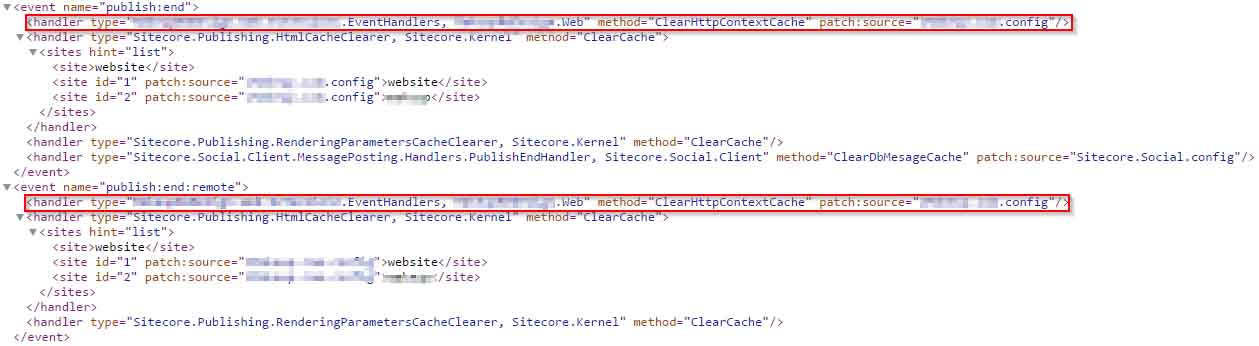
Remember to create a processer that can be triggered on publish:end.
PIPELINE PROFILER
The pipeline profiler is another useful tool that helps you to identify processors/pipelines that take up most of the execution time. With that information you can concentrate the effort looking at the identified processors. There is a fine post about that here.
TIME MEASURE
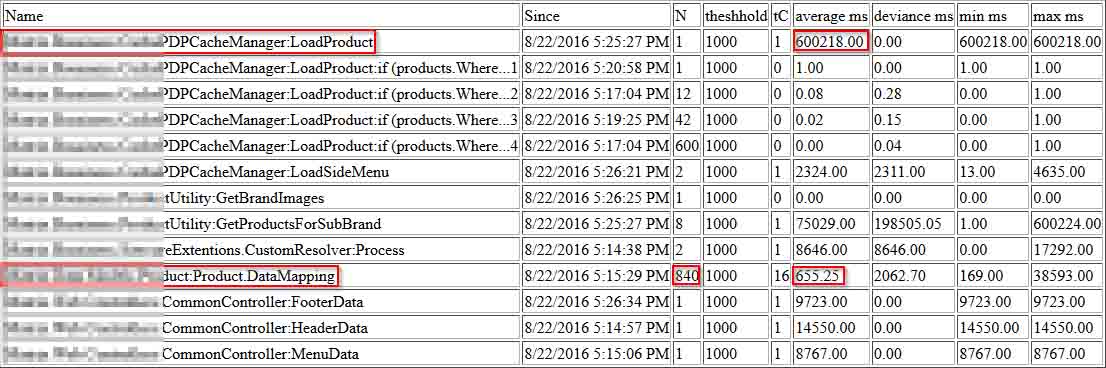
At Alpha Solutions we have created a small simple tool to help measure execution of code. We always include this in our running projects, as this is very light weight.
Below an example of the output of this tool (a rather extreme example). There’s two things to notice here. First off all, the obvious average execution time – column “average ms”. Secondly, and often more important – the column “N” – the number of times a specific method is executed. So even if the method is pretty fast, it can still be a bottleneck.
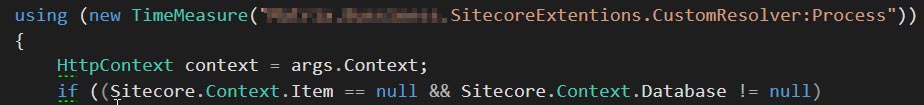
The tools demands that we add using blocks to the code that we want to “measure”.
There are a lot of “professional tools” that can help you doing the same type of measurements. We do not use these tools for exact measurements. We use these tools to quickly identify bottlenecks and help the business getting their performance issues solved short term.

ROLAND VILLEMOES
CTO